Redshift: Integrated Development Environment of Quasar
Quasar Redshift is our integrated development environment (IDE) for Quasar. The IDE is tailored to Quasar programming and provides many features:
- Code editing with syntax highlighting and autocompletion
- Interactive programming
- Rich debugging experience with break and continue, variable tooltips and vector, matrix and image visualizers
- Debugging windows: call stack, variable definition, variable watch pad, breakpoints window, ...
- Programmer-compiler interactivity: Source code compiling as you type, function browsing, comment parsing
- Integrated documentation system and help system
- Integrated OpenGL functionality for fast and efficient visualization
- 2D and 3D image viewer
- Advanced profiling tool with timeline view, kernel analysis using NVIDIA CUDA Profiling Tools Interface (CUPTI)
- Code optimization pipeline visualization.
Quasar Redshift currently runs on Windows and Linux (Ubuntu, Debian, CentOS, ...).
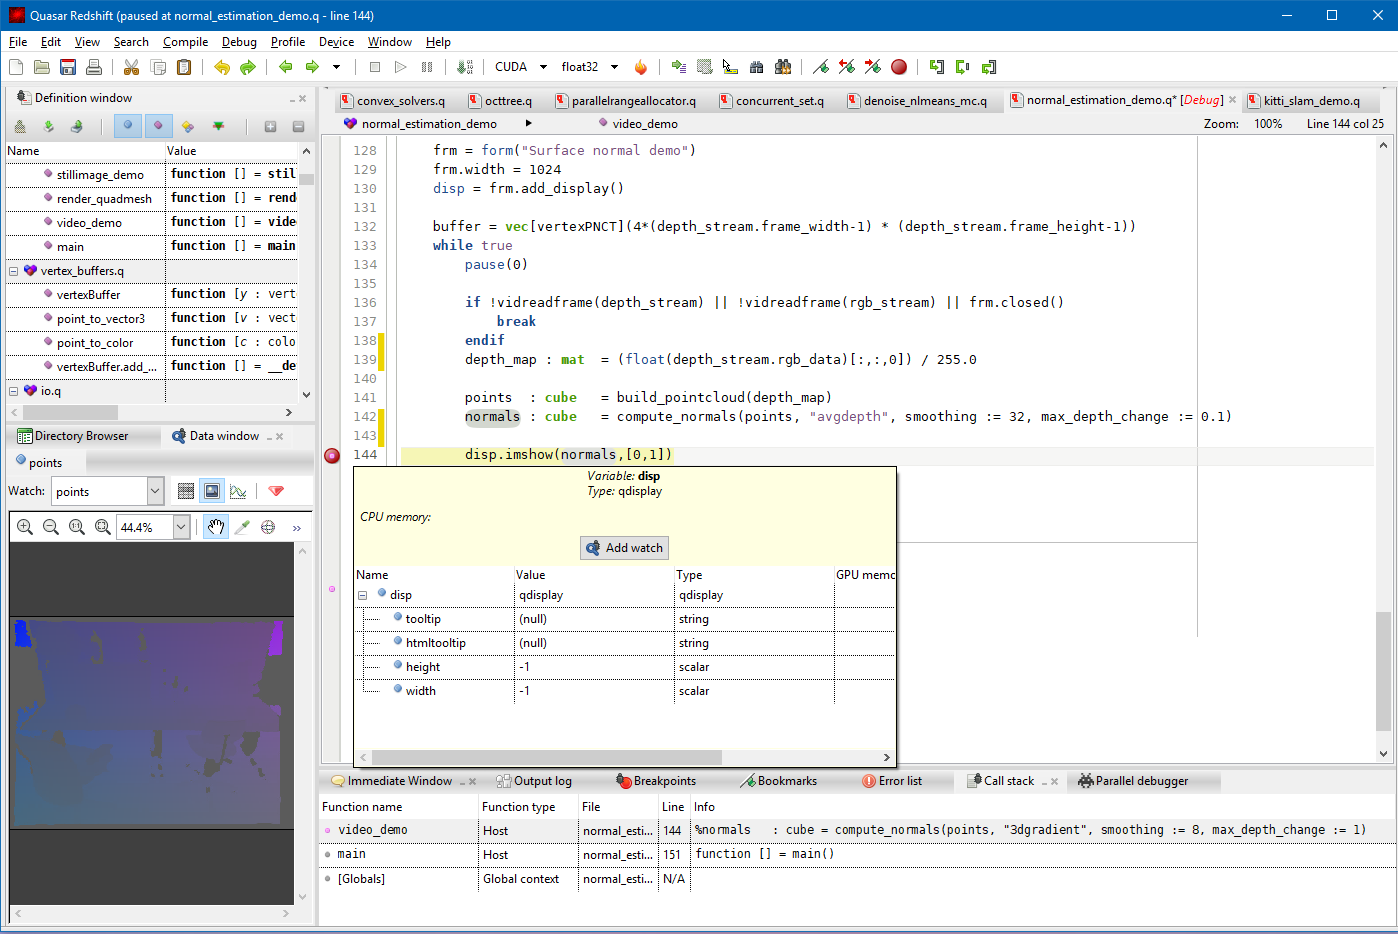
Below, a screenshot of the IDE is displayed during debugging. In the toolbar, it is possible to select the device (CPU/CUDA/OpenCL) to execute the Quasar code. A simple press on the start button (F5) is enough to launch the program. In the screenshot, the mouse is hovering over a local variable and the content of this variable is displayed. On the left, the data window displays the image content of variable 'points'.
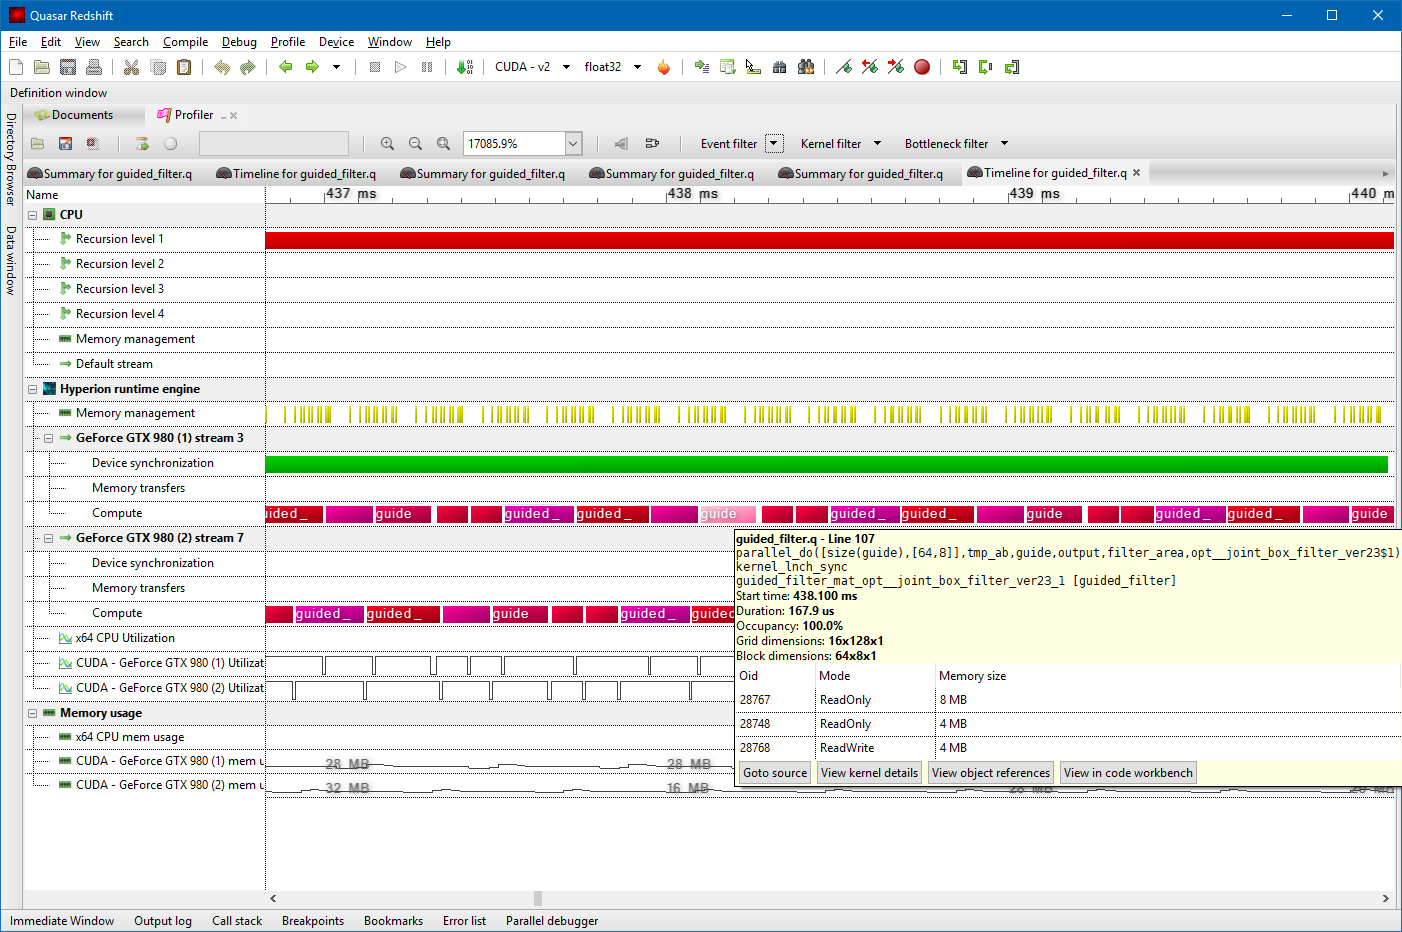
The following screenshot shows the integrated profiler, which uses the NVIDIA CUDA Profiling Tools interface. The same data is basically obtained as with the NVIDIA profiling tools (i.e., nSight or Visual Profiler) but the the results are paired with CPU activity: it is possible to see which functions the CPU is executing while the GPU is active. When using a multi-GPU device configuration, Quasar's runtime scheduler allows kernels to be launched on different GPUs, without any program modification. The communication between the GPUs and between CPU and GPU is handled transparently and optimized behind the screens.
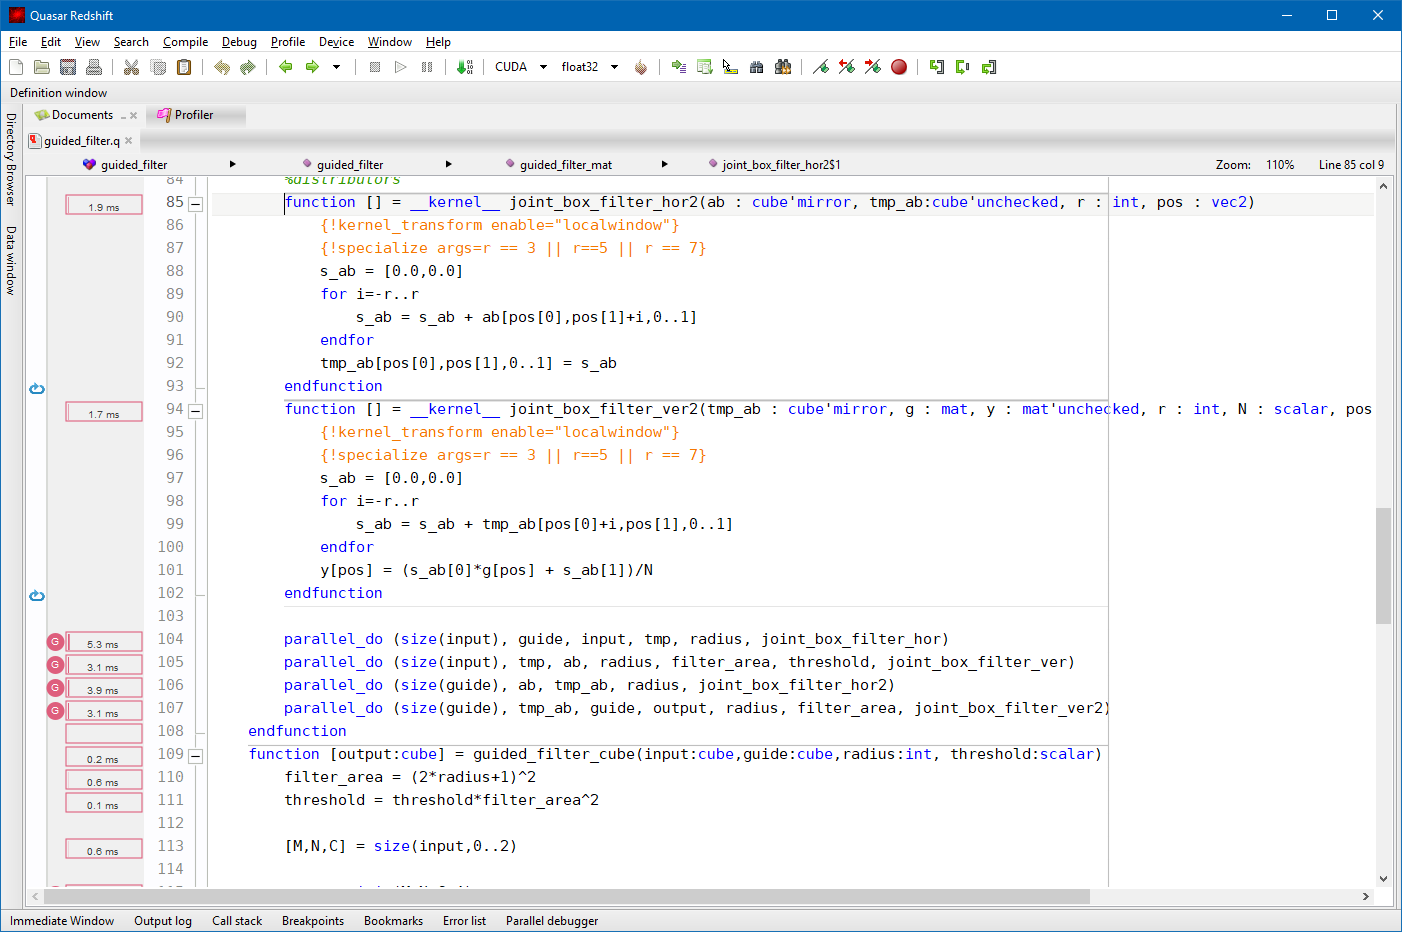
During profiling, it is also possible to see how much time was spent on each of the operations. This way it is easy to locate bottlenecks in the code. Using tooltips, the IDE shows both CPU and GPU timing information.